
Social Media


Growth
Since I began running the DLBA’s social media accounts, we have seen an average growth of 1K followers per year on Twitter, 2.8K followers per year on Instagram, and 300 followers per year on LinkedIn. This has lead us to having a total of 17.5K followers on Twitter, 32.8K followers on Instagram, and 725 followers on LinkedIn.
During the pandemic, our social media really took off. We had multiple posts break records as top performing posts on Twitter, Instagram, and Facebook. In fact, on Twitter and Instagram they became the #1 most engaging posts of all time, with Facebook ranking #3. Each of these posts were organic.
Top Performing Posts

On Twitter our top post was a clip of the East Village’s nightly cheer for frontline workers during the early days of the pandemic. The video itself had over 20K views and the post had over 36K impressions.
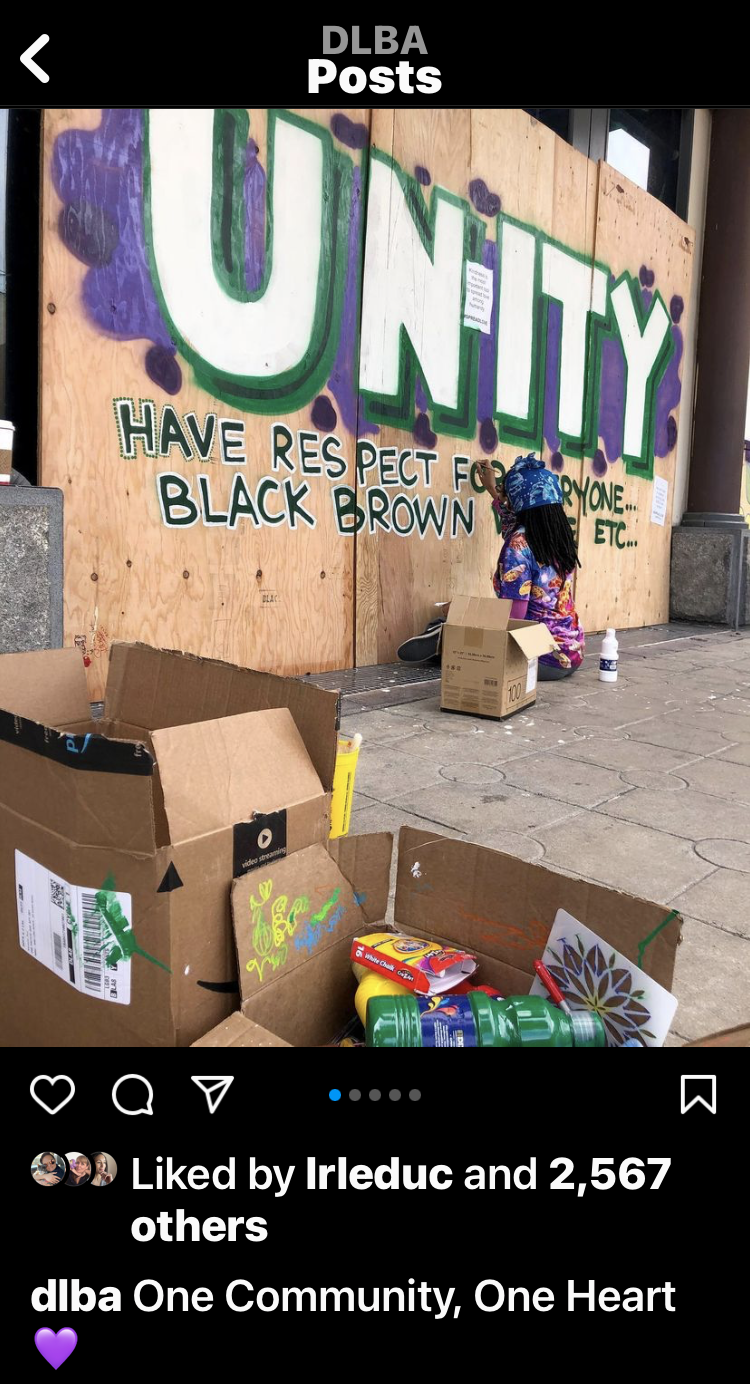
On Instagram our top post was a photo carousel of artists painting boarded up storefronts with inspirational messages. This post had nearly 300 shares and over 22K impressions.
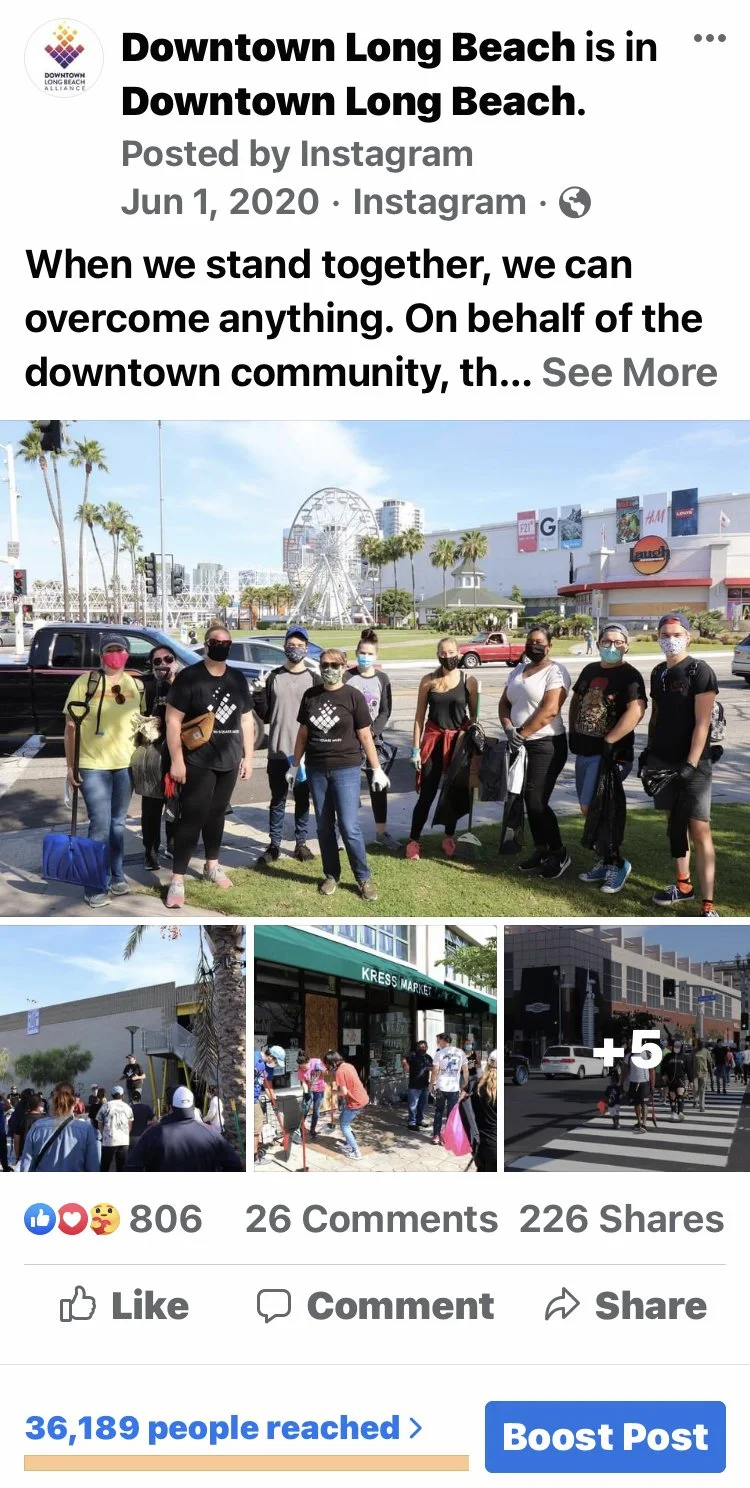
On Facebook our top post was a collection of photos from the June 1, 2020 Downtown clean-up. This post was a great example of the family-like community that is found in Long Beach. People from all over the city came out to help, and the work was completed in just a few hours. The results of this post had over 10K engagements and reached more than 36K people.
Top Performing Campaigns
Dtlb gift card Giveaway
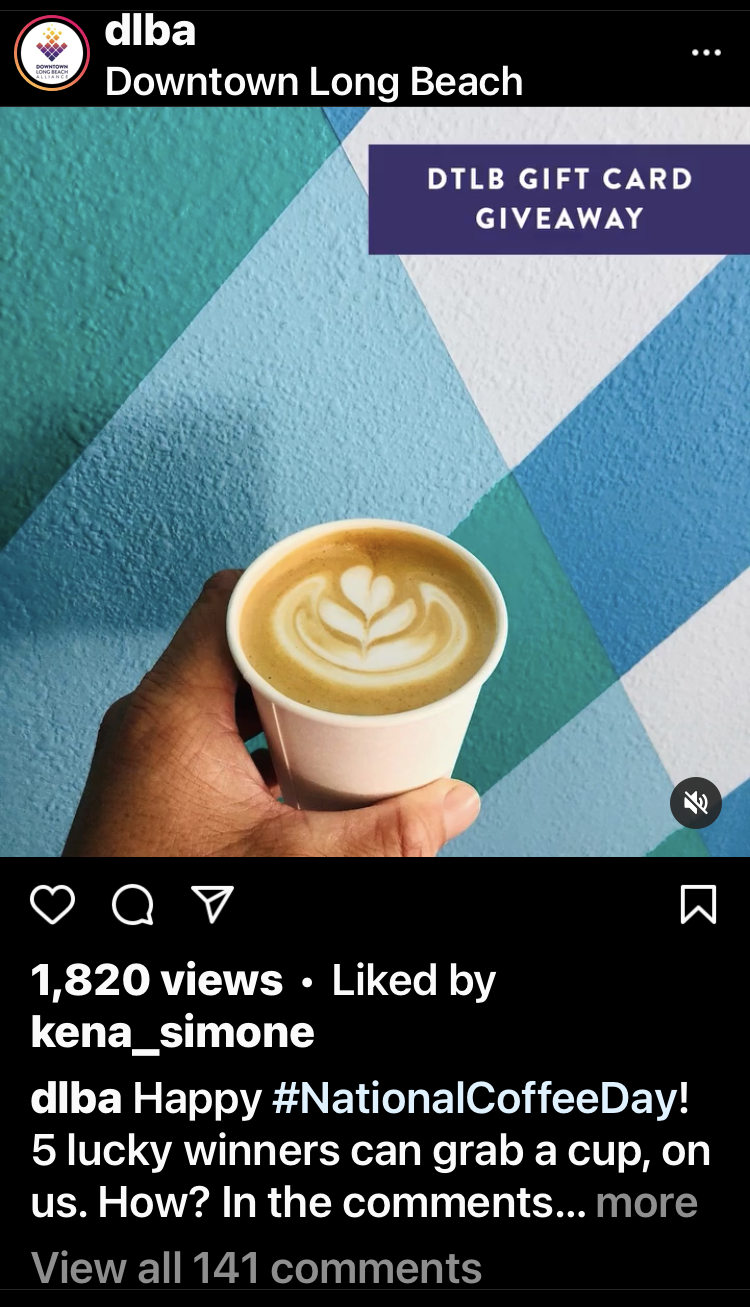
At the onset of the pandemic I began running a gift card giveaway on Instagram to help support small businesses and stimulate the economy. The giveaway series started on March 24, 2020 and is still running today, just in a limited capacity compared to its initial launch.
Results
To date, we have spent over $20K on small businesses in Downtown Long Beach for our gift card giveaway. On average, each post in our giveaway series will have 60 entries and 5K impressions. In total, we have had 9,700 entries and over 820K impressions throughout our series.
Virtual Taste of Downtown
Due to the COVID-19 pandemic, our annual summer event, Taste of Downtown, had to be canceled. In its place, we developed a new event designed to promote DTLB businesses, as Taste of Downtown would, but in a virtual format. From this, Virtual Taste of Downtown was born. Unlike our traditional Taste of Downtown, Virtual Taste of Downtown was open to all types of businesses—not just restaurants. Virtual Taste of Downtown started off as a 2-day virtual event, and eventually switched to be just 1 evening per month. The process was simple, we’d take volunteering businesses and give them an online platform with our 50K followers to promote their business and show off their greatest assets with demos & tours. The event originally had all businesses livestream, but we found that it was easier on the businesses to have them pre-record their content and then send it to us. Once we received the content, I would stream it in one continuous stream through the software OBS. Businesses would often sell kits to follow along with cooking tutorials or have sales in celebration of their upcoming feature in Virtual Taste of Downtown. We would often have themes for our monthly event, ranging from holidays like Halloween, Valentine’s Day, and Earth Day to fun activities like Happy Hour and Backyard BBQ editions.
Results
On average, each event would reach about 22.6K people with the highest reach for an event at 39.5K individuals. Our main audience for Virtual Taste of Downtown was Women ages 35-44, which is consistent with our Facebook followers’ demographic. Virtual Taste of Downtown ran for 12 months and reached a total of over 270K people.
